Google AI introduces PaperBanana, an innovative agentic framework designed to automate the creation of publication-ready methodology diagrams and statistical plots for academic research.
This revolutionary system streamlines the often-laborious process of visually communicating complex scientific discoveries, ensuring accuracy and aesthetic quality.
For researchers, the journey from groundbreaking discovery to published paper is often fraught with hidden challenges. While artificial intelligence has begun to assist with literature reviews and even code generation, the art of visually representing complex ideas—crafting intricate diagrams or precise statistical plots—has remained a time-consuming bottleneck, demanding significant manual effort and design expertise. This often means valuable research time is diverted to perfecting visual elements rather than focusing on scientific breakthroughs.
Now, imagine a world where your research findings can be translated into stunning, accurate visuals with unprecedented ease. This is precisely the future Google and Peking University are unveiling with PaperBanana, an intelligent framework poised to transform how academics share their insights.
By taking on the visual communication burden, PaperBanana empowers researchers to dedicate more energy to the core of their work, accelerating the pace of scientific advancement.
The Bottleneck of Research Visuals
In the demanding world of academic publication, high-quality illustrations are not just aesthetic enhancements; they are critical components for conveying complex methodologies and data insights. Historically, generating these publication-ready diagrams and plots has been a highly labor-intensive process.
Even as AI tools have begun to assist researchers with tasks like literature reviews and coding, the visual communication aspect of research has largely resisted automation, leaving scientists to grapple with design software and intricate data visualization libraries manually.
This often leads to delays, inconsistencies, and a diversion of precious intellectual resources from core research activities.
How PaperBanana Works: A Multi-Agent Symphony
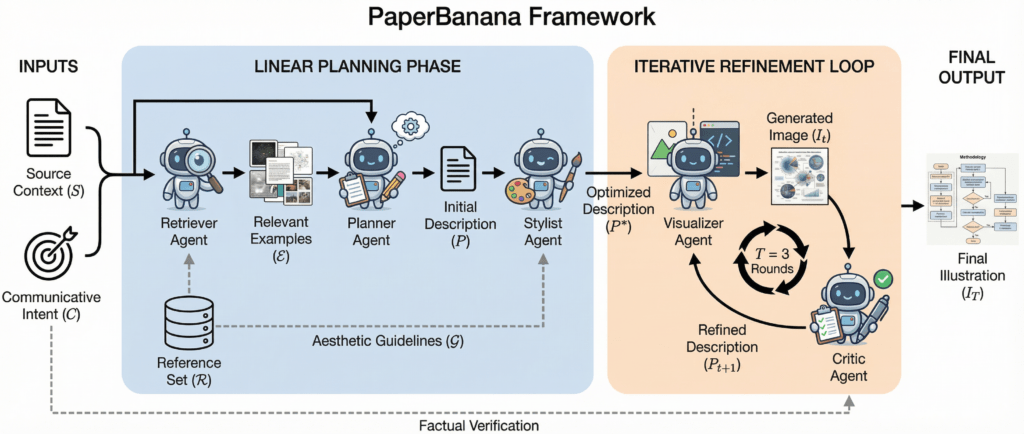
PaperBanana doesn’t rely on a single, monolithic AI model. Instead, it operates as a sophisticated multi-agent system, orchestrating a collaborative team of five specialized AI agents.
This “agentic framework” allows PaperBanana to transform raw technical text into professional, high-quality visuals through a two-phase generation process: Linear Planning and Iterative Refinement.
Phase 1: Linear Planning
This initial phase focuses on establishing the foundational requirements and stylistic guidelines for the visual output.
- Retriever Agent: This agent scours a vast database of existing research publications, identifying the 10 most relevant examples. These examples serve as crucial reference points, guiding the style, structure, and overall presentation of the target figure.
- Planner Agent: Taking the technical methodology text provided by the user, the Planner Agent translates this into a detailed textual description of the desired figure. It essentially outlines what needs to be visually represented and how.
- Stylist Agent: Acting as a dedicated design consultant, the Stylist Agent ensures the generated visual adheres to specific aesthetic standards, such as the widely recognized “NeurIPS Look.” It recommends appropriate color palettes, layouts, and graphical elements to achieve a professional and domain-appropriate appearance.
Phase 2: Iterative Refinement
Once the initial plan and style are established, the system moves to refine the visual output through a collaborative feedback loop.
- Visualizer Agent: This is where the magic happens. For methodology diagrams, the Visualizer Agent employs powerful image generation models, like Nano-Banana-Pro, to create the visual output based on the detailed description. For statistical plots, which demand numerical precision, it takes a different approach: writing executable Python Matplotlib code to generate the plot, ensuring data fidelity.
- Critic Agent: The Critic Agent plays a crucial role in quality control. It rigorously inspects the newly generated image or plot, comparing it against the original source text to identify any factual errors, visual glitches, or inconsistencies. It then provides constructive feedback, initiating up to three rounds of refinement, where the Visualizer Agent regenerates the visual based on the Critic’s suggestions.
Setting New Benchmarks: Outperforming the Rest
To rigorously evaluate PaperBanana’s capabilities, the research team introduced PaperBananaBench, a comprehensive dataset comprising 292 test cases curated directly from actual NeurIPS 2025 publications. Using a cutting-edge VLM-as-a-Judge approach, they benchmarked PaperBanana against leading baseline systems. The results clearly demonstrated PaperBanana’s superior performance:
| Metric | Improvement over Baseline |
|---|---|
| Overall Score | +17.0% |
| Conciseness | +37.2% |
| Readability | +12.9% |
| Aesthetics | +6.6% |
| Faithfulness | +2.8% |
The system particularly excels in crafting ‘Agent & Reasoning’ diagrams, achieving an impressive 69.9% overall score. Furthermore, PaperBanana incorporates an automated ‘Aesthetic Guideline’ that favors a sophisticated ‘Soft Tech Pastels’ palette over harsh primary colors, contributing to its enhanced visual appeal.
Precision in Plots: The Code-Based Advantage
Statistical plots demand numerical precision, a quality that traditional image generation models often struggle to deliver, sometimes leading to “numerical hallucinations” or repeated elements. PaperBanana addresses this critical challenge by intelligently switching its generation approach for statistical plots.
Instead of drawing pixels directly, the Visualizer Agent writes executable Python Matplotlib code. This code-based generation ensures 100% data fidelity, meaning the plots accurately represent the raw data provided, eliminating the common pitfalls of image-based approaches.
A direct comparison highlights this trade-off:
| Feature | Plots via Image Generation (IMG) | Plots via Coding (Matplotlib) |
|---|---|---|
| Aesthetics | Generally higher; plots look more “visually appealing” | Professional and standard academic look |
| Fidelity | Lower; prone to “numerical hallucinations” | 100% accurate; strictly represents the raw data provided |
| Readability | High for sparse data but struggles with complex datasets | Consistently high; handles dense or multi-series data without error |
Tailoring Aesthetics: Domain-Specific Design
One of PaperBanana’s ingenious features is its ability to adapt visual aesthetics to match the specific expectations and conventions of different research domains. This ensures that the generated visuals are not just accurate but also resonate with the scholarly community they are intended for.
| Research Domain | Visual ‘Vibe’ | Key Design Elements |
|---|---|---|
| Agent & Reasoning | Illustrative, Narrative, “Friendly” | 2D vector robots, human avatars, emojis, and “User Interface” aesthetics (chat bubbles, document icons) |
| Computer Vision & 3D | Spatial, Dense, Geometric | Camera cones (frustums), ray lines, point clouds, and RGB color coding for axis correspondence |
| Generative & Learning | Modular, Flow-oriented | 3D cuboids for tensors, matrix grids, and “Zone” strategies using light pastel fills to group logic |
| Theory & Optimization | Minimalist, Abstract, “Textbook” | Graph nodes (circles), manifolds (planes), and a restrained grayscale palette with single highlight colors |
Key Takeaways
- Multi-Agent Collaborative Framework: PaperBanana is a sophisticated, reference-driven system that orchestrates five specialized agents—Retriever, Planner, Stylist, Visualizer, and Critic—to convert raw technical text and captions into publication-quality methodology diagrams and statistical plots.
- Dual-Phase Generation Process: Its workflow involves a Linear Planning Phase, which retrieves reference examples and sets aesthetic guidelines, followed by a 3-round Iterative Refinement Loop where the Critic agent identifies errors for the Visualizer agent to correct.
- Superior Performance on PaperBananaBench: Evaluated against 292 test cases from NeurIPS 2025, the framework significantly outperformed vanilla baselines across key metrics, including Overall Score (+17.0%), Conciseness (+37.2%), Readability (+12.9%), and Aesthetics (+6.6%).
- Precision-Focused Statistical Plots: For numerical data, the system intelligently shifts from direct image generation to writing executable Python Matplotlib code, ensuring absolute numerical precision and eliminating the “hallucinations” common in standard AI image generators.
PaperBanana represents a significant leap forward in scientific communication, empowering researchers to present their findings with unprecedented clarity, accuracy, and aesthetic appeal. By automating a historically challenging aspect of research, Google’s new AI tool allows the scientific community to focus more on discovery and less on design.
Join our community by subscribing to our Weekly Newsletter to stay updated on the latest AI updates and technologies, including the tips and how-to guides. (Also, follow us on Instagram (@inner_detail) for more updates in your feed).
(For more such interesting informational, technology and innovation stuffs, keep reading The Inner Detail).